When it comes to stats of International Cricket, the Internet is a great resource. It is full of interesting stats like, Sanath Jayasuriya has more ODI wickets than Shane Warne; Dravid has more ODI fifties than Ponting!
For all its powers though, certain things which are beyond the Internet are taken care of by legendary cricket statisticians like Bapoo Mama, Anandji Dossa, and Sudhir Vaidya.
But how much do we know about Grassroots (aka local) Cricket played in India? Kind of Cricket played by you and your friends?
Wouldn’t it be interesting to see the stats of millions of amateur cricketers and how do different regions of India compare with each other there? Well, we think so.
With about 3 million registered cricketers, 300,000 cricket matches scored, 19000+ tournaments and 2000+ locations in India (at the time of writing), CricHeroes is in a good position to unearth interesting patterns of grassroots Cricket in India. Thus we decided to dig some data and found some fascinating insights.
In this article, we have tried to cover general patterns of Indian Grassroots Cricket. In the next article, we will cover some individual or specific stats. So, let the journey begin!
Score all your matches for free.
From friendly matches to big tournaments, CricHeroes helps you score, livestream, and analyse your game.
Like International Cricket, we do like to play Limited Over matches more but we do play Test Matches whenever the situation permits.
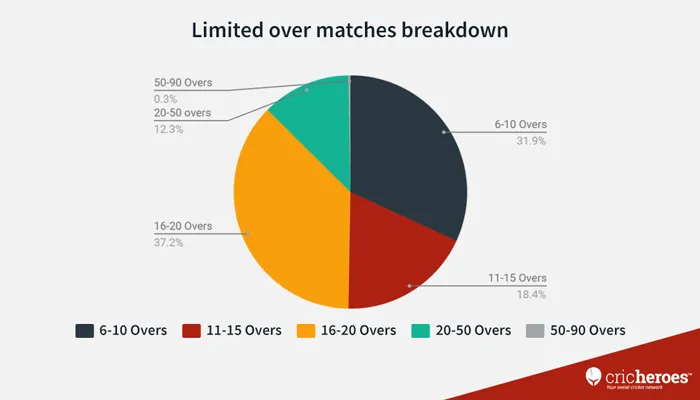
Out of 270,000+ matches scored on CricHeroes (only in India) at the time of this exercise, about 265,000 matches are Limited Over matches and here is a further breakdown.
Are you a cricket expert?
Prove your knowledge and earn a certificate of expertise.
It’s clear that majority of amateur cricketers prefer to play 16–20 overs matches, something which can be completed in ~3 hours followed by 6–10 overs matches, which is less time-consuming. 20–50 over matches are preferred by Cricket Associations (we have 50+ of them) and Professional Leagues.
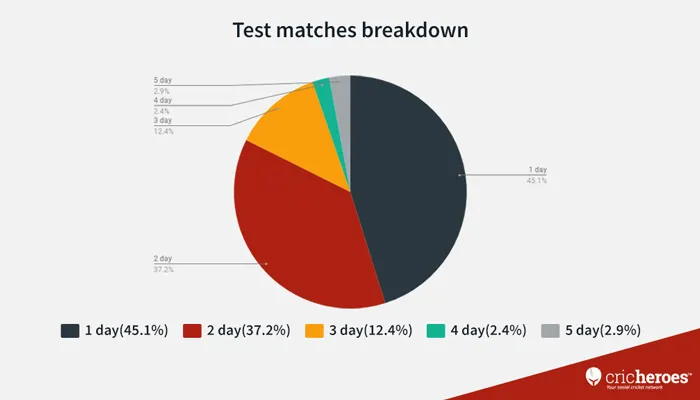
In the case of Test Matches, 1-day Test Match is very popular. Basically, you try to wrap all 4-innings in a day (or a few hours). Rest of the Test Match formats are mostly preferred by Cricket Associations.
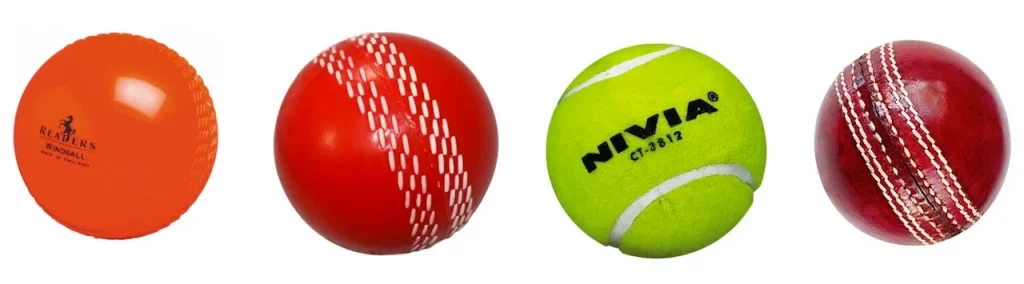
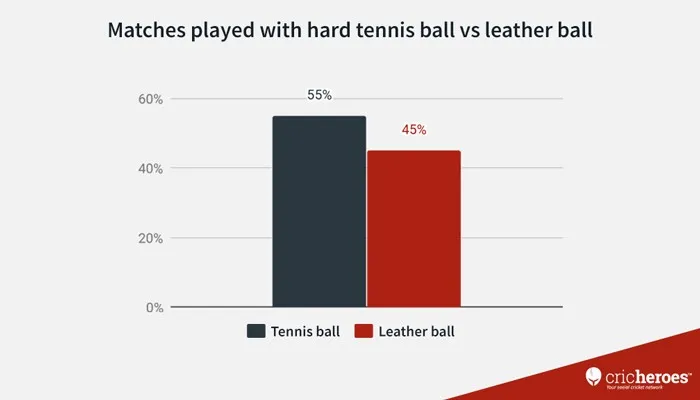
Which type of ball do we like to play cricket with?
Cricket is perhaps the only sport, in which playing with different types of balls requires a significantly different skill set. Red ball, white ball, hard tennis ball, and even tape ball demands different abilities from both, batsmen and bowlers!
We have considered both red ball and white ball as Leather ball and both hard and soft tennis ball as a Tennis ball for our analysis. The Tennis ball is generally preferred over Leather ball in grassroots cricket because of its ease to play with but one can’t beat the shine, swing, and pace of a Leather ball, which is why it is preferred in semi-pro and professional cricket. But the difference is not so huge after all!
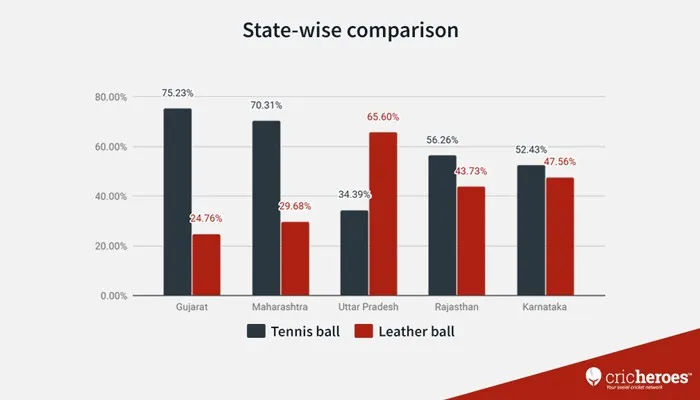
If we look at state-wise, majority of matches (66%) in Uttar Pradesh (mainly NCR region) are played with Leather ball. In all other states, a higher number of matches are played with Tennis ball and Gujarat tops the list with 75% matches played with Tennis ball (mostly hard tennis ball).
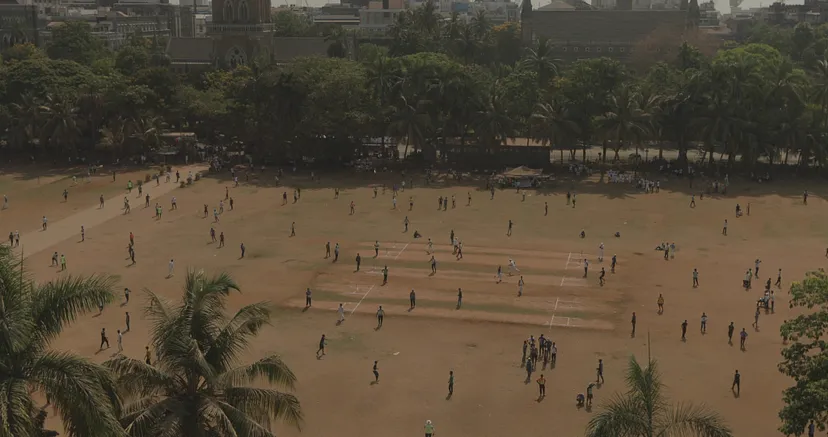
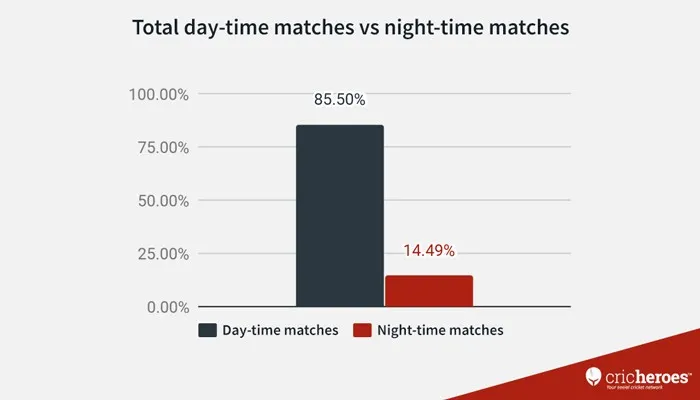
When does India play cricket?
Summer vacation or not, we always see our local grounds (or empty patches of land, empty roads, etc.) occupied with a group of cricketers playing cricket. Whether there is scorching heat or chilling cold, passion for cricket drives everyone to the ground. But when do we play more Cricket, in the morning or evening? As per our data, India like to play Cricket in the day-time!
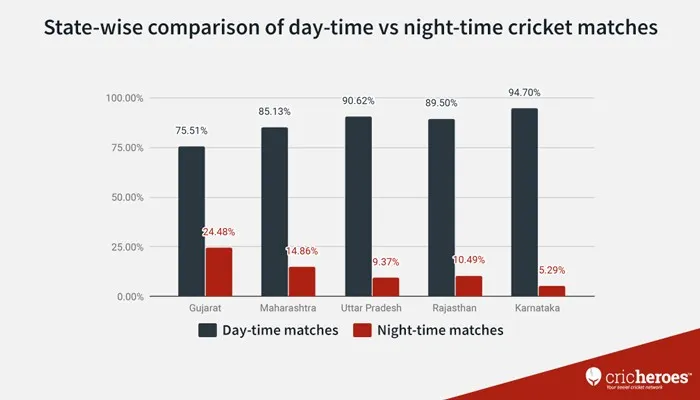
Karnataka tops in playing day-time matches followed by Uttar Pradesh whereas Gujarat plays more number of night-time matches compared to any other state. Why? Because all party plots of Gujarat are Cricket Grounds as well!
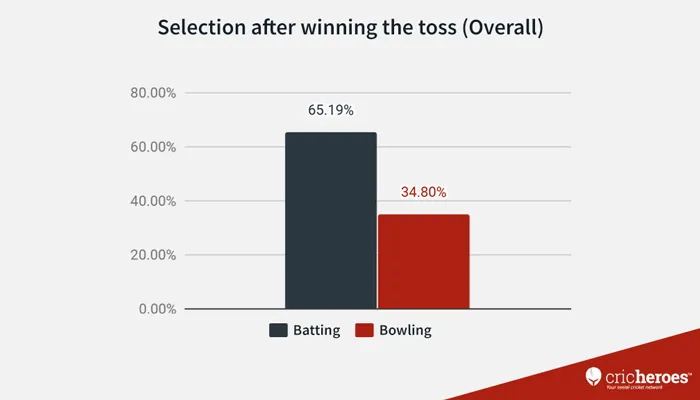
Now, what do cricketers do after winning the toss?
The phrase, win the toss and bat, isso embedded into the fabric of Cricket that even the captains of amateur teams wouldn’t dare to send the opposition in on a brisk Sunday morning. When we measure it in numbers, it’s the same story.
Over 65% of local teams select batting over bowling after winning the toss.
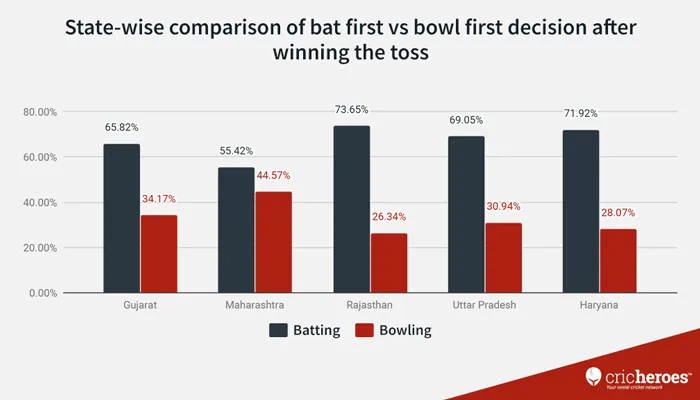
If we go state-wise, the story is the same. Batting dominates the choice of our gully cricketers. In Rajasthan, the percentage of the teams choosing to bat first is the highest and also the percentage of teams choosing to bowl first is the lowest. However, in Maharashtra, this difference only 11%. Fascinating!
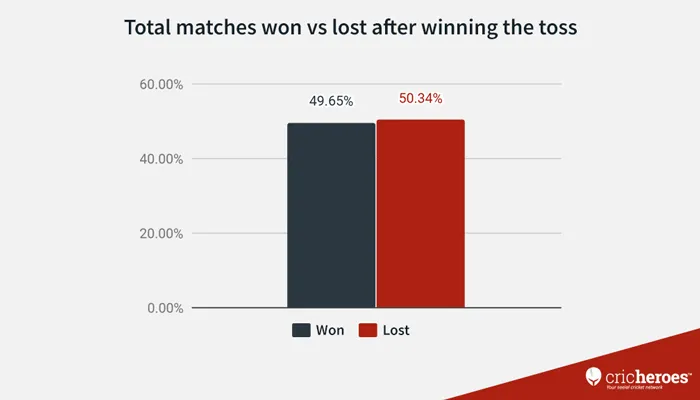
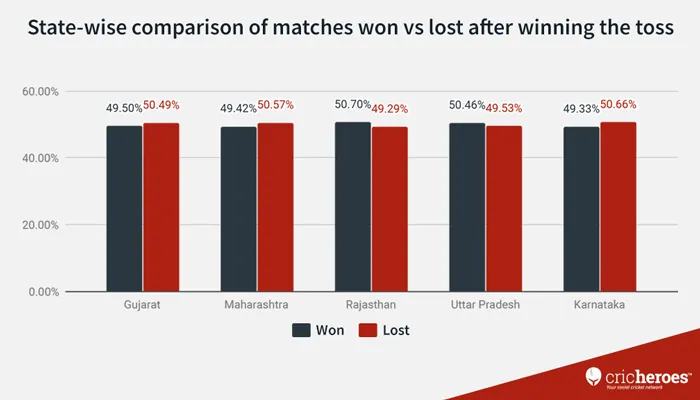
But wait, how many matches are won after winning the toss? Just less than 50%.
Well, winning the toss is not a great advantage after all, is it?
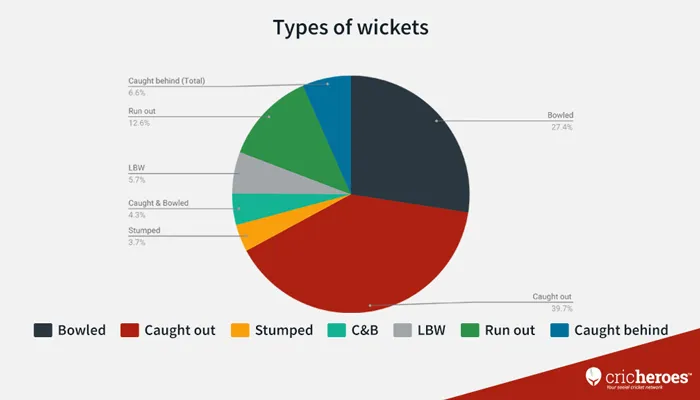
How do cricketers get out?
The most common way to get out in International Cricket is Caught Out, which is true for amateur cricket as well followed by Bowled and Run Out.
But there are more interesting insights here. Getting out as Mankaded is rare in International Cricket but here we have 3000+ wickets as mankaded (we still need to find out if the number has gone sharply upwards after Ashwin incident!), whereas 409 wickets are Timed out which has never happened in the International Cricket history!
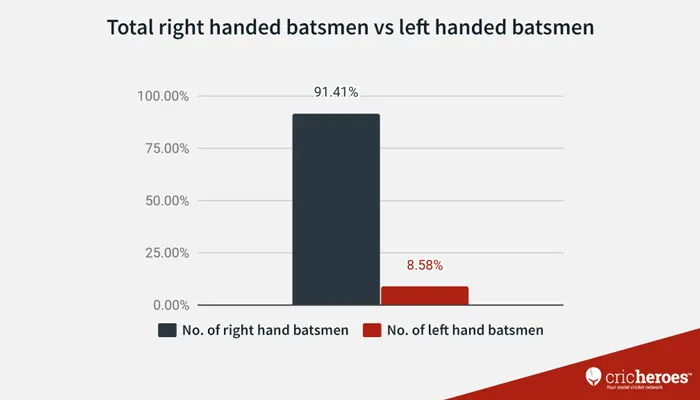
Right Handed vs Left Handed
Now let’s do some comparisons.
How many left-handed batsmen and bowlers we have in India? Well, we can give you an absolute number based on data we have so far but it will not be true as we don’t have each and every cricketer on CricHeroes yet! However, we can give you patterns.
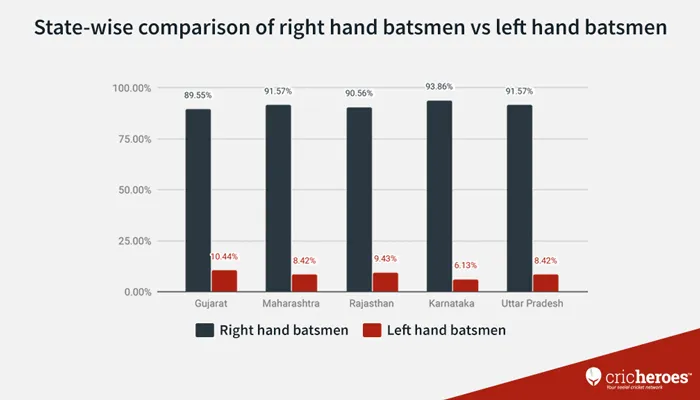
Most teams will have 1 or 2 left-handed batsmen and data tells the same story. 8.58% of the total batsmen are left handed at the time of writing. If we dig a little deeper and find a state-wise comparison, Gujarat has the most and Karnataka has the least number of LHB. Come on India, we certainly need likes of Dada and Gambhir.
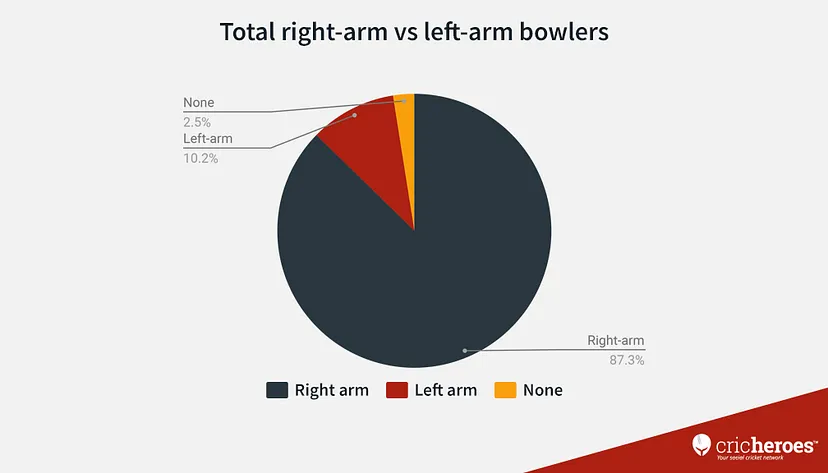
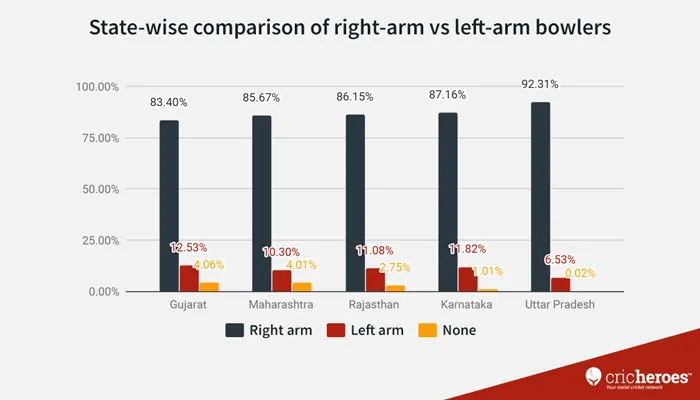
Now let’s talk about Left-arm Bowlers. We have a slightly better ratio here. Just above 10% of all bowlers are Left-arm bowlers.
If we go state-wise, once again Gujarat has the highest and Uttar Pradesh has the least number of left-arm bowlers compared to other states.
Pace Bowling vs Spin Bowling
In Cricket, pacers, and spinners both play a significant role based on the conditions. The presence of the likes of Dennis Lillee, Imran Khan and the fearsome pace quartet from West Indies meant that pace bowlers ruled the roost in the 1970s and 80s. The entry of Shane Warne and Muttiah Muralitharan at the start of the 1990s, you could argue, made the next decade and more very much their era.
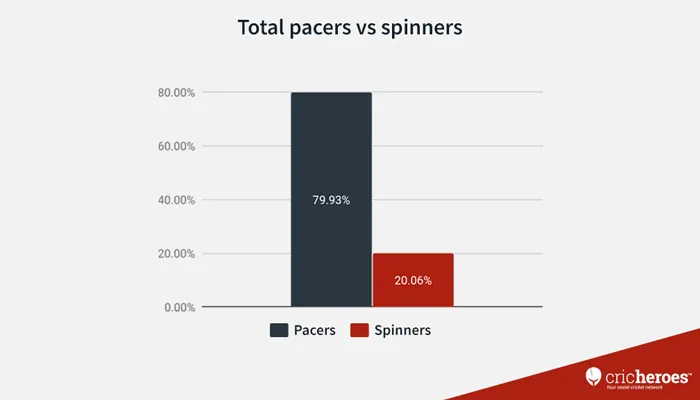
In our data, we find that pacers surpass spinners by almost 60% in absolute numbers.
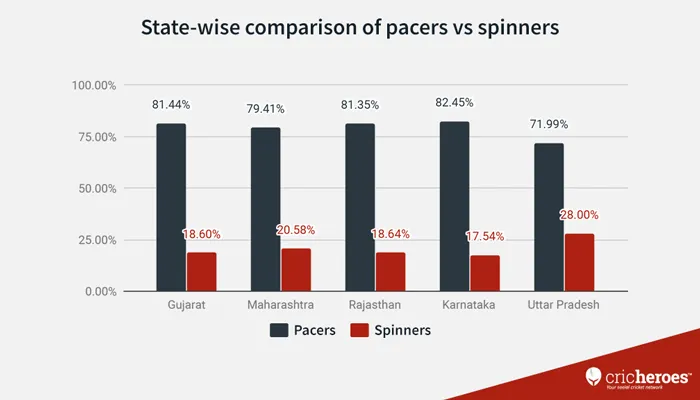
When we look at state-wise data, Uttar Pradesh has a higher number of spinners comparatively. Thank you guys for giving us, Kuldeep Yadav!
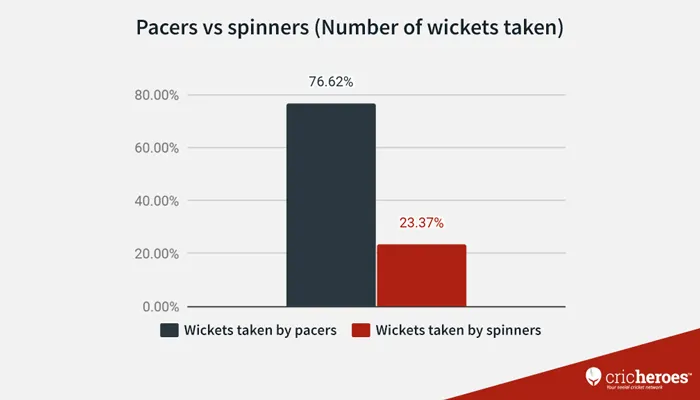
But who is more effective?
In absolute numbers, obviously, the number of wickets taken by pacers is higher than spinners.
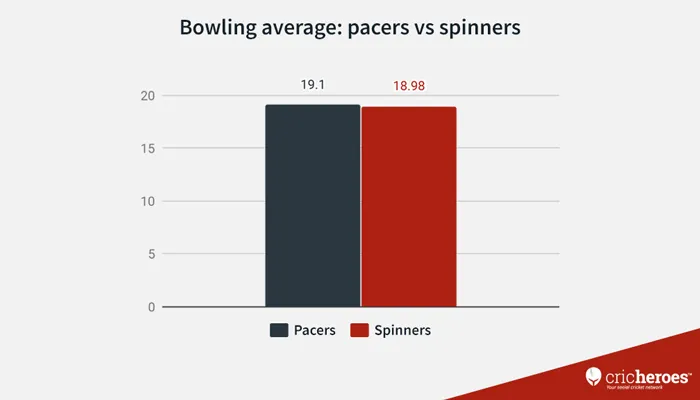
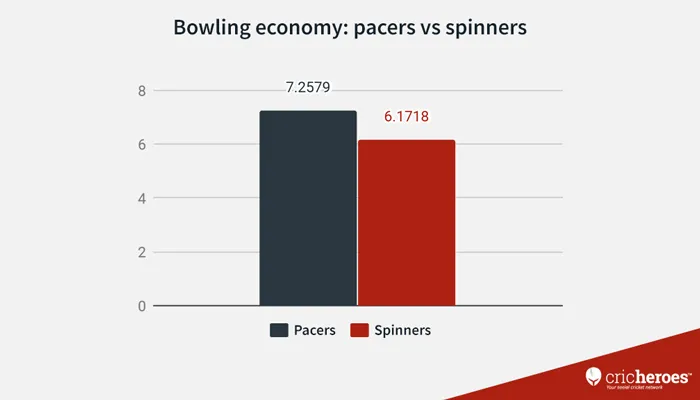
But if you look at bowling average and economy, this is where they stand.
Spinners have both, better bowling average and economy than pacers!
Power Play vs Death Overs
It is no secret that Cricket is a batsman’s game now. With the introduction of T20 Cricket and concepts like Power Play, bowlers are forced to innovate not for taking wickets but how to avoid getting too many runs in their spells. And then there are death overs!
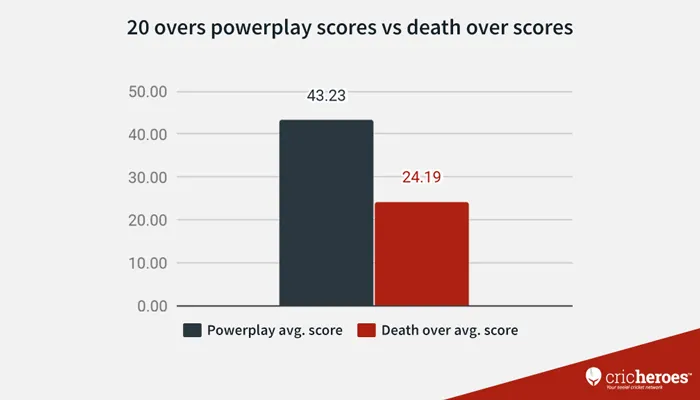
We wanted to find out when do teams score more runs? Out of all the matches recorded on CricHeroes so far, we considered only 20-over matches for this analysis and what did we find?
Average score clinched by batsmen in power play (first 6 overs) is about 43 runs whereas in death overs (last 4 overs) is 24 runs.
The power play has an edge over death overs.
In a way it is obvious because power play generally has standard top order batsmen and more often than not, death overs are played by tailenders.
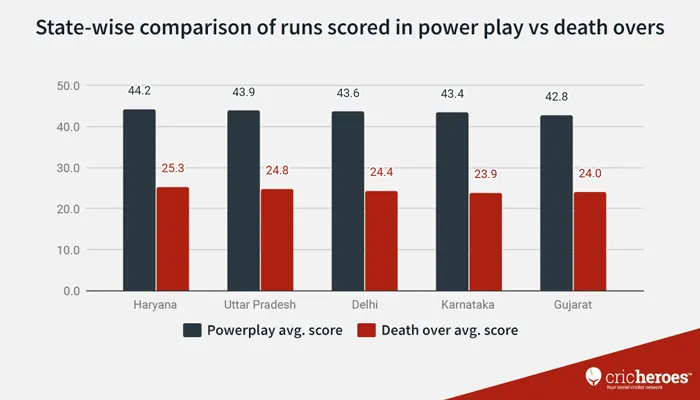
The story is almost similar across states.
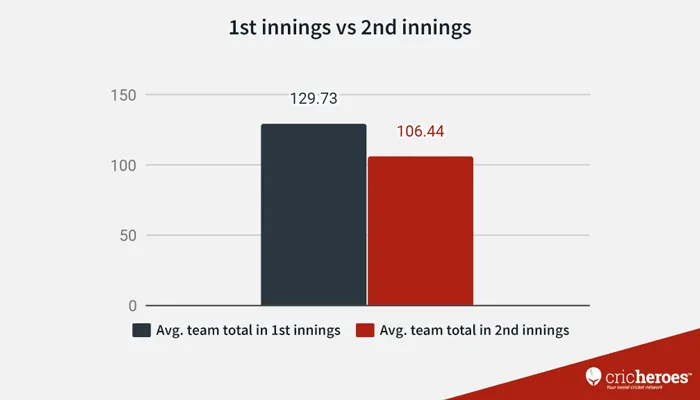
1st Innings vs 2nd Innings
Generally, teams score more in the 1st innings as there is no pressure of chasing and data tells the same story. Here also we considered only 20-over matches out of all.
Teams batting first have scored 129 runs on an average while teams batting second have scored around 106.
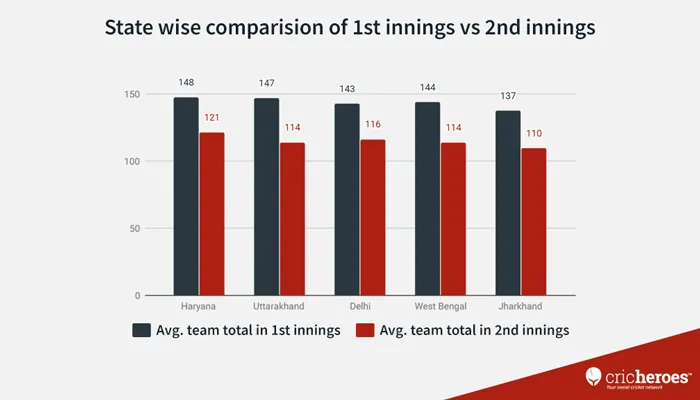
State-wise data shows that Haryana tops both the categories with an average of 148 and 121 respectively. Uttarakhand has the second highest score average in 1st innings but 2nd innings average is same as West Bengal. Jharkhand has the lowest result for both.
That’s all for now, phew!
Well, we know a lot more can be found from this data and we will continue doing so. This is our first attempt to make meaning out data we are collecting since late 2016.
So what do you think? What would you like to know more?
Let us know your thoughts and questions in comments and we will try our best to incorporate them in future articles around this topic.
SEO All-Rounder
Dhaval Jain is a cricket writer and content strategist at CricHeroes who writes on grassroots cricket, team strategy, cricket technology, and how the game is played at the recreational level. His work draws directly on match data and community insights from the world’s largest cricket platform — making it grounded in how cricket is actually lived, not just watched.
CricHeroes is the #1 cricket scoring app globally, with 4 crore+ cricketers using it to live score their local matches and tournaments. For cricket apparel and accessories, visit the CricHeroes Store.